Instrument performance
On-sky efficiency
Observations of Altair during S24B allowed us to estimate the injection efficiency of the PL with the newly installed AO3k - NIRPyWFS. We present here the results in the form of histograms representing the injection efficiency and total throughput of the instrument (throughput from top of the atmosphere down to the detector) computed on the Altair data at two wavelengths (642nm and 680nm) :
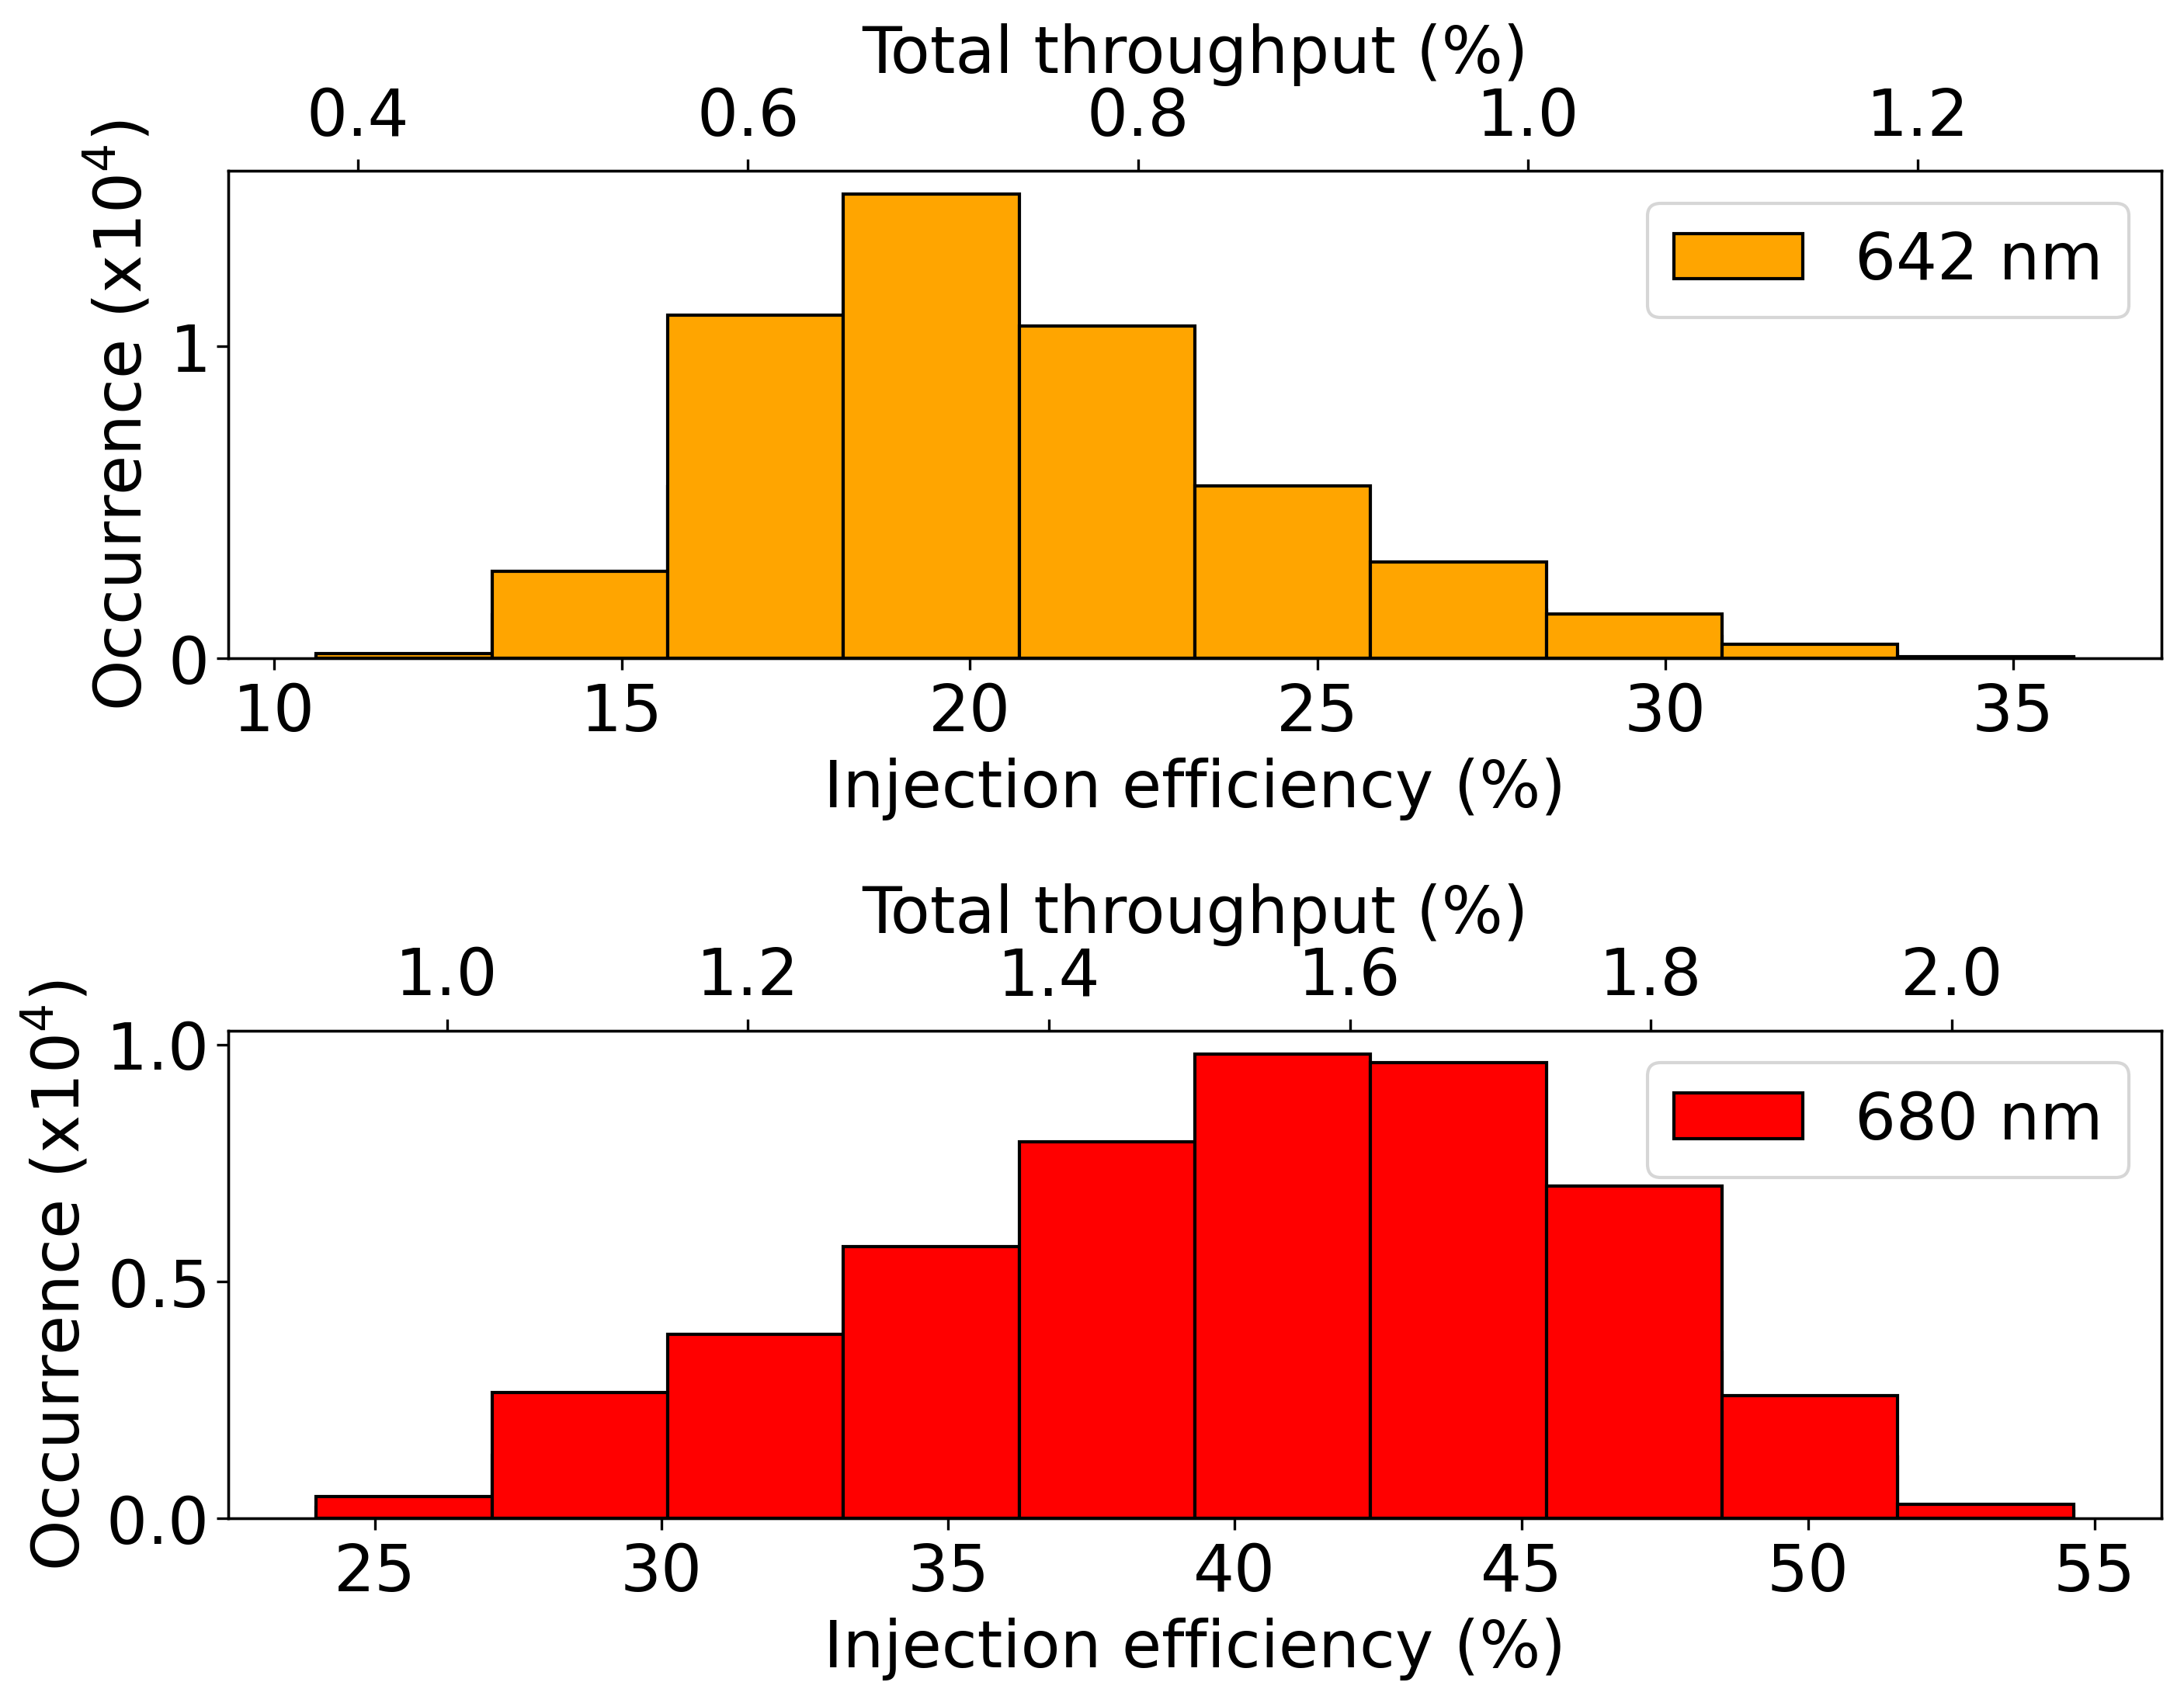
On-sky total throughput and injection efficiency performance at 642 nm (top) and 680 nm (bottom)
During this observation sequence, the Strehl ratio was measured at 20-30% at 750 nm. At 642 nm, the average injection efficiency was 21% (with a maximum of 36%), compared to ~60% achieved in laboratory conditions. At 680 nm, the average injection efficiency was 40% (with a maximum of 55%).
Sensitivity
The detector noise consists of the readout noise (~0.25 e⁻/pixel in standard/slow readout mode) and the shot noise of the stray light (currently 0.03 e⁻/pixel/s). Assuming the most extreme case of a 10-s frame time, the total noise is sqrt(0.3+0.25^2)=0.6 e⁻/pixel per 10 s. Each wavelength channel is spread over 5 pixels (perpendicular to the dispersion axis), so the noise per wavelength channel is 1.35 e⁻ per 10 s.
The signal corresponds to the number of detected photons per spectral element. It can be computed analytically using a spectral resolution of 3000, 19 outputs, 3 wavelength channels per resolution element and an overall transmission of 1% (telescope + instrument + detector QE). For a target of magnitude 0, this yields approximately 1.5×10⁶ e⁻ per 10 s.
The limit of sensitivity is reached when the signal-to-noise ratio (SNR) decreases below 5 per spectral element. It happens when we can detect 25 photons. It can be computed analytically using a spectral resolution of 3000, 19 outputs, 3 wavelength channels per resolution element and an overall transmission of 1% (telescope + instrument + detector QE). For a target of magnitude 12, this yields approximately 25 e⁻ per 10 s. In this case, the SNR dominates with respect to the detector noise (5e- compared to the 1.35e- stated above). The sensitivity of the instrument is therefore R=12. It can be slightly increased by having integration times longer than 10s, but it is not recommended for normal operations. Moreover, although an SNR of 5 is sufficient to form an image, significantly more photons are required to achieve high contrast and high astrometric accuracy. The astrometric accuracy improves roughly with the square of the number of detected events. To reach an accuracy 100 times better than the diffraction limit requires an SNR of about 10⁴. Such an SNR can only be reached in approximately 30 minutes on a star of magnitude R ≈ 5.
Spectroastrometric precision
Spectro-astrometry enables the measurement of photocenter positions as a function of wavelength, providing spatial information at scales well below the diffraction limit.
Recent observations of the β CMi decretion disk (Kim et al 2025) demonstrate the operational capabilities of this mode. Figure 7 shows the measured photocenter positions as a function of wavelength across the Hα line, while the right panels decompose this signal along the disk’s major and minor axes.
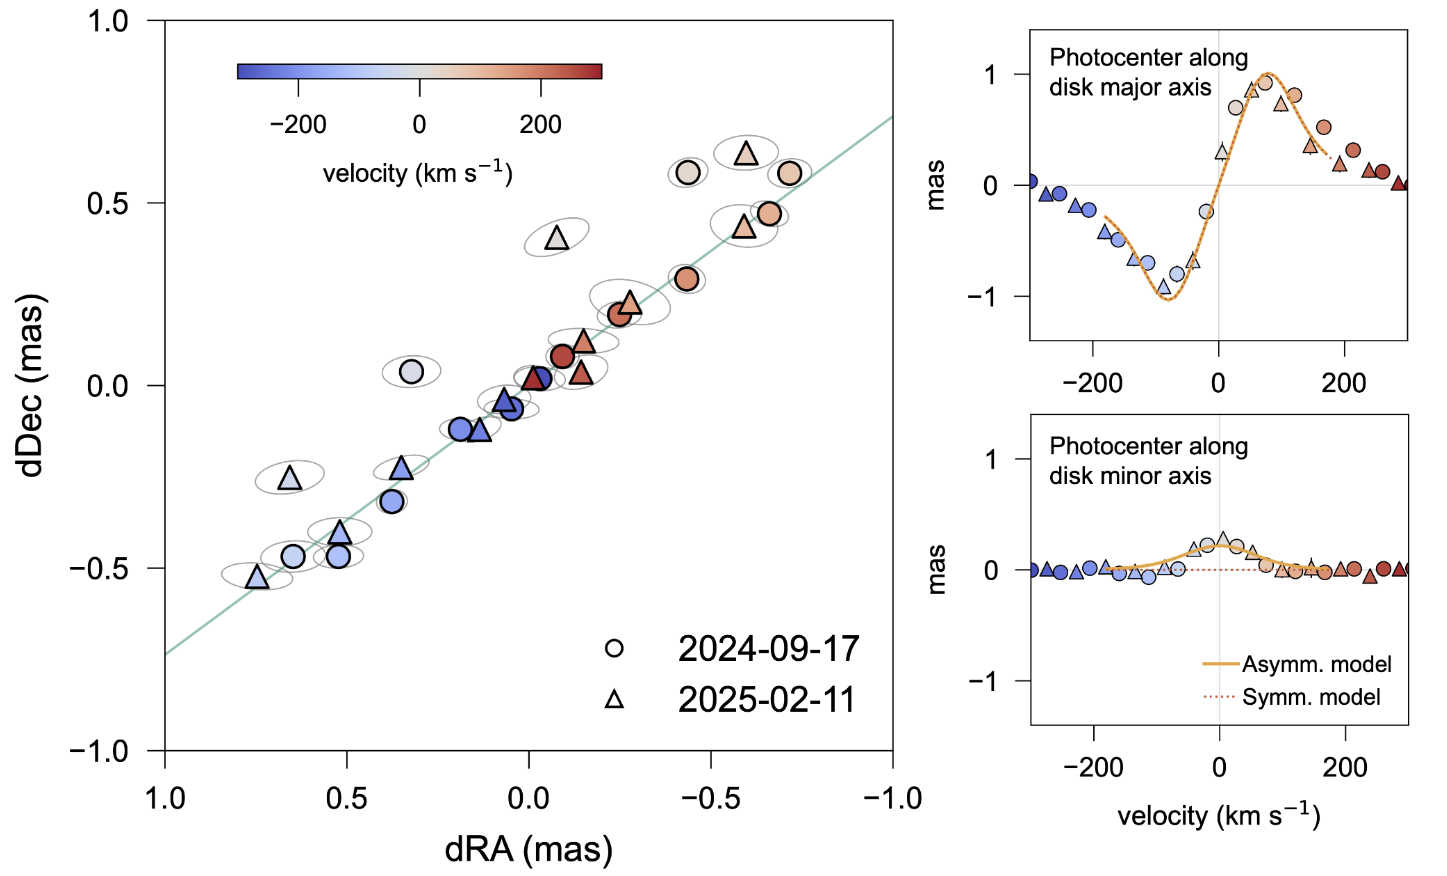
Spectroastrometry of β-CMi, a classical Be star with an Hα decretion disk, done with the 19-port PL feeding the R~3,000 spectrograph. (Left) Photocenter position as a function of wavelength (velocity). (Right) Spectroastrometric signatures along the disk major axis (top) and minor axis (bottom). Credit: Kim et al., 2025